viernes, 1 de diciembre de 2023

Does a change in price has always the same effect in customer demand?


Price elasticity of demand is a measurement of the change in the consumption of a product in relation to a change in its price, in other words, how sensitive the quantity demanded is to its price. 

Economists use price elasticity to understand how supply and demand for a product change when its price changes.

Depending on its elasticity, a good is said to have elastic demand, inelastic demand, or unitary elastic demand.

If demand is elastic, the quantity demanded is very sensitive to price.

If demand is inelastic, the good's demand is relatively insensitive to price, with quantity changing less than price.

If demand is unitary elastic, the quantity falls by exactly the percentage that the price rises.

Two important special cases are perfectly elastic demand, where even a small rise in price reduces the quantity demanded to zero; and perfectly inelastic demand, where a rise in price leaves the quantity unchanged. 

Factors That Affect Price Elasticity of Demand

Availability of substitute goods: The more and closer the substitutes available, the more elastic is that good likely to be, as people can easily switch from one good to another if an even minor price change is made. If no close substitutes are available, the demand inelastic.

Breadth of definition of a good: The broader the definition of a good or service, the lower the elasticity.

Percentage of income: The higher the percentage of the consumer's income that the product's price represents, the higher the elasticity (more elastic) tends to be, as people will pay more attention when purchasing the good because of its cost.

When the goods represent only a negligible portion of the budget the income effect will be insignificant and demand inelastic,

Necessity: The more necessary a good is, the lower the elasticity (more inelastic), as people will attempt to buy it no matter the price.

Duration: For most goods, the longer a price change holds, the higher the elasticity is likely to be, as more and more consumers find they have the time and inclination to search for substitutes. 

Brand loyalty: An attachment to a certain brand can override sensitivity to price changes, resulting in more inelastic demand.

Addictiveness: Goods that are more addictive in nature tend to be more inelastic. This is because consumers treat such goods as necessities and hence are forced to purchase them, despite even significant price changes.

Based on all of the above, it is important that the demand forecaster is familiar with pricing actions taken by the company and anticipate their impact on demand.


viernes, 27 de octubre de 2023

Logistionary: Kanban


Kanban is a visual scheduling system for lean manufacturing.

It all started in the early 1940s when the first Kanban system was developed by Taiichi Ohno for Toyota automotive in Japan. It was created as a simple planning system, the aim of which was to control and manage work and inventory at every stage of production optimally.

The Kanban method gets its name from the use of kanban, visual signalling mechanisms to control work in progress for intangible work products.

Kanban aligns inventory levels with actual consumption. A signal tells a supplier to produce and deliver a new shipment when a material is consumed. This signal is tracked through the replenishment cycle, bringing visibility to the supplier, consumer, and buyer.

In contexts where supply time is lengthy and demand is difficult to forecast, often the best one can do is to respond quickly to observed demand. This situation is exactly what a kanban system accomplishes, in that it is used as a demand signal that immediately travels through the supply chain.

Kanban cards are a key component of kanban, and they signal the need to move materials within a production facility or to move materials from an outside supplier into the production facility. The kanban card is, in effect, a message that signals a depletion of product, parts, or inventory. When received, the kanban triggers replenishment of that product, part, or inventory.

Three-bin system

An example of a simple kanban system implementation is a "three-bin system" for the supplied parts, where there is no in-house manufacturing. One bin is on the factory floor (the initial demand point), one bin is in the factory store (the inventory control point), and one bin is at the supplier. The bins usually have a removable card containing the product details and other relevant information, the classic kanban card.

When the bin on the factory floor is empty (because the parts in it were used up in a manufacturing process), the empty bin and its kanban card are returned to the factory store (the inventory control point). The factory store replaces the empty bin on the factory floor with the full bin from the factory store, which also contains a kanban card. The factory store sends the empty bin with its kanban card to the supplier. The supplier's full product bin, with its kanban card, is delivered to the factory store; the supplier keeps the empty bin. This is the final step in the process. Thus, the process never runs out of product, and could be described as a closed loop, in that it provides the exact amount required, with only one spare bin so there is never oversupply.

If all this is confusing, and you´re still not clear on how Kanban works, Im sure the next image will make everything fall into place! One image is indeed worth a thousand words as they say!


martes, 3 de octubre de 2023

Kaizen: All you need to know


Kaizen is a business philosophy that focuses on continuous improvement across the entire organization. The pursue of the kaizen model is to help companies focus on gradually and consistently increasing efficiency and reducing waste within processes. That doesn't mean alterations happen slowly. The kaizen process simply recognizes that small changes now can have huge impacts in the future.

To achieve all this, kaizen encourages input from any employee, from the factory floor to the most senior management.

The kaizen method became popular in Japan, at manufacturers like Toyota. Kaizen can broadly be translated as means continuous improvement in Japanese.

There are five fundamental Kaizen principles that are embedded in every tool and behaviour:

1. Know your customer

2. Let it Flow

3. Go to Gemba

4. Empower People

5. Be Transparent


Traditionally, kaizen has been known for its events, usually a three- to five-day team workshop in which employees, managers, and sometimes C-suite executives make an actionable plan to improve an existing process. Kaizen events often follow Gemba Walks or the discovery of an inefficiency. We have spoken about Gemba Walks in the past, these are visits to workplaces where management teams can witness processes, talk to employees, gather insights, and identify any issues. You can read more about Gemba Walks in here.

After you’ve identified problems or bottlenecks in a process, start making small, continuous improvements. During the kaizen event, team members collaborate and think of solutions. The ideal outcome of these events is an actionable plan that is ready for implementation.

Kaizen events can take many forms to best serve their business application.

1. Focused-improvement kaizen. A focused-improvement event is a kaizen event centred on a single, known issue. Prioritize your most important losses and develop solutions to eliminate them.

2. Waste kaizen. This type of event focuses on eliminating waste in your processes, as opposed to improving systems that are currently working.

3. Error-proofing kaizen. Use this type of event to reduce human error by improving processes. This could be as simple as standardizing checklists, automating parts of a system or using Poka Yoke which we talked about here.

4. Lead-time kaizen. This kind of event is suitable when you realize one of your processes is taking too long. The event aims to reduce the amount of time it takes to complete a process, like the time from processing an order to the customer receiving their goods.

How to run a Kaizen event:

There is not a unique way to conduct a kaizen event but the plan-do-check-act (PDCA) framework is common and often recommended method.


1. Plan

The Gemba Walk, mapping your value stream, and identifying the problems in your processes are part of the planning stage in a PDCA cycle. Follow these steps to get started.

  • Speak to employees. They’re the people who know the daily process better than anyone, so find out what problems or issues they're aware of.
  • Define and analyse the problem. When you’ve decided which issue to tackle, break it down and find the bottleneck in the process.
  • Establish the metrics you’ll use to measure success. Without this data it’s impossible to analyse the results after you’ve tested the solution.
  • Decide on a goal. You should have one goal that is achievable within the event time frame.
  • Work as a team to find solutions to the problem. There should be no limits on the kind of solutions encouraged. Allow employees to use their creativity. Choose one with potential to start with.


2. Do

Run a small-scale test of your chosen solution. Make sure every team member involved is aware of the change and let it run long enough to gather meaningful data and feedback.

3. Check

Collect data from your test and assess its success.

4. Act or adjust

If the test was a success, scale, implement your improved process company-wide or as a permanent update. However, if you found issues, or if the solution didn’t work, refine the process, and run further tests or choose a different solution and try again.

This should be a cyclical process. The kaizen event might be a one-time event but the process of improving never stops. To keep the continuous loop going, repeat the cycle. Find more processes to improve or try out other solutions
.

miércoles, 13 de septiembre de 2023

Gartner 2023 top 25 Supply Chain companies


Gartner has once more released the results from its annual Global Supply Chain Top 25, identifying leading supply chain organizations, highlighting trends and sharing best practices.

Schneider Electric claimed the top position in the list this year, followed in second place by Cisco Systems, which capped a run of three consecutive years in the top position last year. Colgate-Palmolive, Johnson & Johnson and PepsiCo rounded out the top five positions. Tesla, AB Inbev, GlaxoSmithKline and Dow were the new entrants on the list.

Some interesting moved over the years with companies joining the list and some others being relegated; in these links you can check how the ranking has evolved over the last few years:

2016

2018

2021

Gartner continues to recognize sustained supply chain performance via the “Masters” category, introduced in 2015. To be considered Masters, companies must have attained top-five composite scores for at least seven out of the last 10 years. Amazon, Apple, P&G and Unilever all qualified for the category this year.


jueves, 3 de agosto de 2023

Logistionary: Kano model


The Kano model is a theory for product development and customer satisfaction developed in the 1980s by Noriaki Kano, a professor of quality management at the Tokyo University of Science.

It´s an approach to prioritizing features on a product roadmap based on the degree to which they are likely to satisfy customers. Product teams can weigh a high-satisfaction feature against its costs to implement to determine whether or not adding it to the roadmap is a strategically sound decision.

The model involves two dimensions:

1. Achievement (the horizontal axis), which goes from the supplier didn’t do it at all to the supplier did it very well.

2. Satisfaction (the vertical axis), which goes from total dissatisfaction with the product or service to total satisfaction with the product or service.

It also identifies three levels of customer expectations: that is, what it takes to positively impact customer satisfaction

1. Expected needs: These are the must haves, the requirements that the customers expect and are taken for granted.

These expectations are also known as the dissatisfiers because by themselves they cannot fully satisfy a customer. However, failure to provide these basic expectations will cause dissatisfaction.

Examples: In a hotel, providing a clean room is a basic necessity. In a call center, greeting customers is a basic necessity.

2. Normal needs: These are known as the wants or the satisfiers because they are the ones that customers will specify from a list. They can either satisfy or dissatisfy the customer depending on their presence or absence.

Examples: Time taken to resolve a customer's issue in a call center. Waiting service at a hotel.

3. Exciting needs: These are features and properties that make a supplier a leader in the market. These are the delighters or exciters because they go well beyond anything the customer might imagine and ask for. Their absence does not dissatisfy the customer, but their presence improves the likelihood of purchase.

Examples: In a callcenter, providing special offers and compensations to customers or the proactive escalation and instant resolution of their issue is an attractive feature. In a hotel, providing free food is an attractive feature.

How Does the Kano Model Work?

Using the Kano Model, product teams pull together a list of potential new features vying for development resources and space on the roadmap. The team will then weigh these features according to the two competing criteria:

1. Their potential to satisfy customers.

2. The investment is needed to implement them.


miércoles, 19 de julio de 2023

A deep dive into Cost to Serve

 
Cost to Serve or Cost to Deliver has been a concept that we have explored in the past, you can find the last post we published in this link: The importance of Cost to Serve in Supply Chain.

In this post, we are going to deep dive further on this concept and shed some light around the different components that can impact cost to serve.

First things first, a quick reminder of what is cost to serve; It is the total cost of providing a product or service to a customer including all direct and indirect costs.

Direct costs are those that can be directly traced to the production or delivery of the product or service, while indirect costs are those that are not easily traced to the specific product or service but are still incurred in the process of providing it.

Now onto why understanding your cost to serve is important.

By understanding how much it costs to serve each customer, companies can segment their customers and identify potential areas for cost savings. It can also be used to evaluate different pricing strategies and understand how changes in price may impact overall costs ultimately helping organizations to transform unprofitable customers into profitable ones.

But what is the best way to determine cost to serve, and what are the different elements that make up this metric?

There are several elements and categories that need to be captured to be able to analyse cost to serve and have some meaningful data to work with:

1- Customer: Customer services overheads, order management, customer specific services, presales costs etc

2- Sourcing and manufacturing: Sourcing and procurement, cost of goods, production costs, manufacturing costs etc.

3- Warehousing: Picking packing and storage cost.

4- Delivery/Transportation: Transport, last mile delivery, returns and reverse logistics etc.

Finally, how do we put everything together and calculate cost to serve?

This is the easiest part, providing you have managed to do the hardest part which is to identify all the different costs impacting your operations. Once this information is ready, it´s just a question of subtracting from the customer sale price all these different elements, leaving you with a data point that can be compared across all customers in your organization.


miércoles, 5 de julio de 2023

The Carbon Footprint of the Food Supply Chain


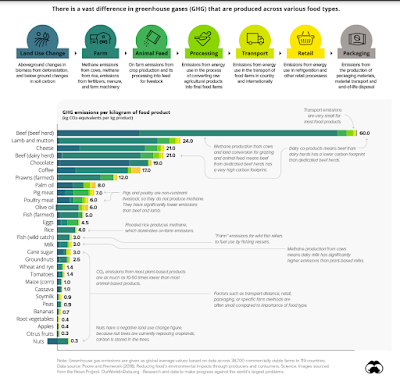
The quantity of greenhouse gases generated by our food can vary considerably across the global food supply chain.

The difference types of food we could eat can have a significant impact on greenhouse gases emissions on the environment.

Across all foods, the land use and farm stages of the supply chain account for 80% of the emissions.

On the other end of the spectrum is transportation. This stage of the supply chain makes up 10% of total emissions on average.

Worldwide, there are approximately 13.7 billion metric tons of carbon dioxide equivalents (CO2e) emitted through the food supply chain per year. Unsurprisingly, beef and other animal products have considerably greater effect on emissions.

For example, one kilogram (kg) of beef results in 60 kg of GHG emissions, making beef the greatest contributor to greenhouse gases. In contrast, the same weight of apples produces less than one kilogram of greenhouse gases emissions.

When it comes to plant-based foods, chocolate is among the highest GHG emitters. One kilogram of chocolate produces 19 kg of greenhouse gases. On average, emissions from plant-based foods are 10 to 50 times lower than animal-based types.


lunes, 15 de mayo de 2023

Hoshin Kanri: translating strategic plans into actionable items


Many companies struggle with translating strategic plans into actionable items on a daily process, luckily, among the most powerful tools in the Lean arsenal for effective strategic management we can find Hoshin Kanri.

Similar Jidoka or Just in Time, Hoshin Kanri has its roots in the Toyota Production System and as a tool, it can be very helpful, when implemented properly, in bridging the gap between strategy and execution.

Hoshin Kanri has a Matrix shape with four quadrants each devoted to a specific task.

1-     Set the strategic vision & goals (3-5 year breakthrough objectives):


The long-term goals is the starting point In Hoshin Kanri, normally in the frame between 3 and 5 years.


List them at the bottom quadrant of the matrix template and have in mind that every initiative will have many smaller tasks that will need to process before achieving the goal.


2-     Define key mid-term objectives (annual objectives)


After your long-term goals are all set, prepare the most important objectives that you aim to achieve in a shorter time frame and put them in the left quadrant of the Hoshin matrix.


3-     Set short-term actions and metrics (improvement priorities)


You will need to fill the top quadrant with the most important activities that need to be completed to achieve the short-term goals, this is basically the to-do list for the upcoming months.


4-     Agree on key performance indicators (targets to improve)


Agree on the most crucial metrics that need to be improved and list them on the diagram.


Following this line of thought, right next to the key metrics, you need to list the key stakeholders responsible for leading the completion of the activities in the matrix's top quadrant.


Finally, you should complete the picture by specifying the dependencies between every listing in your matrix.


jueves, 20 de abril de 2023

How Domino's Became The World's Biggest Pizza Chain


Robots, self-driving cars, artificial inteligence...the new frontier for most companies, including fast food.

This is what has taken Dominos to become the biggest pizza chain in the world.


viernes, 24 de febrero de 2023

Logistionary: Decoupling inventory


Decoupling inventory is the process of setting aside extra parts or raw materials to ensure there aren’t any delays or disruption in the production of finished goods in the event of a supply shortage or machinery breakdown.

In simple terms, decoupling inventory is a type of safety stock, but what it hedges against is slow production and stoppage, not unseen fluctuations in demand, acting as a buffer that allows to continue fulfilling orders even as production issues are happening.

The main benefits of decoupling stock are:

Increased efficiency: Can increase efficiency across production lines and supply chains by allowing each stage of production to work autonomously even in the event of a disruption.

Increased flexibility: Helps mitigate the effects of unforeseen circumstances helping businesses become more agile and ready to respond to unexpected disruptions in the supply chain.

Perform spot maintenance on parts of your manufacturing equipment: Decoupling inventory is particularly advantageous in the event of a facility outage for repairs or machine maintenance.

Provides Protection During Periods of Uncertainty: When manufacturers are unable to obtain sufficient raw materials to finish producing a product, decoupled inventory offers protection to continue production without any delays.


martes, 24 de enero de 2023

How are Supply Chain issues reshaping fast food value menus

If there has ever been an indicator of inflation, it is fast food value menus. These items or menus have always been the last to reflect changes in prices and have been the last resource indicating whether the economy was at a serious risk.

In the current economic environment, with inflation skyrocketing driven among other things by the several Supply Chain challenges and constraints most of the world are facing, fast food chains have had no other option but to increase the prices on their most iconic menus, leaving customers with the sensation that the old prices are gone for good.

The below video explains some of the challenges fast food chains have been facing and how Supply Chains have been key drivers for the latest price increases.